Speech-to-speech assessment vs text-based assessment of simultaneous interpreting: Tapping into the potential of large language models and the metrics of machine translation quality estimation in enabling automatic assessment
Xiaoman Wang
Heriot-Watt University
Xiaoman.Wang@hw.ac.uk
https://orcid.org/0000-0001-5863-5517
Binhua Wang
Lingnan University
binhuawang@LN.edu.hk
https://orcid.org/0000-0003-2404-5214
Abstract
There is growing interest in using machine translation quality estimation (MTQE) metrics and models and large language models (LLMs) to assess information fidelity in interpreting quality automatically. However, studies have been limited to text-based assessments only. This study compared speech-to-speech (S2S) assessment and text-based assessment. The experiment began by segmenting audio recordings of simultaneous interpreting (SI) into one-minute intervals and isolating the source speech and the target interpretations in each segment. We used LLMs, BLASER, and speech embeddings and the last hidden states from HuBERT and Wav2Vec to assess interpreting quality at the speech level. In addition, we explored the use of automatic speech recognition (ASR) for transcribing segments, coupled with human verification and LLM along with MTQE models such as COMET and TransQuest for minute-level text-based assessment. The findings indicate the following: (1) LLMs cannot conduct the speech-based assessment of interpreting quality directly but demonstrate certain capabilities in text-based assessment when evaluating based on transcriptions, displaying a moderately high correlation with human ratings (Pearson r = 0.66); (2) in contrast, BLASER operates directly at the speech level and demonstrates a comparable correlation (r = 0.63) with human judgements, confirming its potential for speech-based quality assessment; (3) a combined metric integrating both S2S and text-based assessments, as proposed in this study, accounts for approximately 47% of the variance in human judgement scores, which highlights the potential of integrated metrics to enhance the development of machine-learning models for assessing interpreting quality. Such metrics offer an automated, cost-effective, and labour-saving method of evaluating SI by human beings and enable direct quality estimation in end-to-end speech-to-text (S2T) and S2S machine interpreting (MI) systems for continuous quality monitoring during training and deployment.
Keywords: simultaneous interpreting, SI, speech-to-speech assessment, S2S, text-based assessment, automatic assessment, large language model, LLM, machine translation quality estimation, MTQE
1. Introduction
Since the 1980s, interest has been growing in quality assessment in interpreting. This led to the publication of extensive literature about its importance in interpreter training and the multifaceted nature of interpreting quality (Bühler, 1986; Gile, 1995; Harris, 1990; Kurz, 1993, 2002; Moser, 1996; Pöchhacker, 2022; Seleskovitch et al., 1994). This increasing interest has shaped quality assessment into one of the major areas in interpreting studies, with new models and methodologies emerging continuously (Chung, 2020; Fantinuoli & Prandi, 2021; Fernandes et al., 2023; Han & Lu, 2021; Kocmi & Federmann, 2023; Lu & Han, 2022; Wang et al., 2023; Wang & Yuan, 2023).
The prevailing discussion in the field centres on information fidelity – the most important aspect of interpreting quality. Recognizing that human assessment of interpreting quality is cognitively taxing and time-consuming, researchers have begun exploring the automation of this process. Despite recent advances, the development of automated methodologies for assessing interpreting quality is still nascent. The most common method involves automatically transcribing the source speech and its interpretations, followed by employing various metrics or models to assess the information fidelity. Regarding automation, this text-based assessment process still requires human verification to ensure the accuracy of the automatic transcription and alignment. Research on direct speech-to-speech (S2S) assessment in interpreting studies has yet to be conducted.
Against this backdrop, this study uses speech embeddings and the last hidden state to compute cosine similarity, measuring the semantic similarity between the source speech and interpretations. In addition, this research employs S2S translation metrics to assess the fidelity of information. The outcomes of these speech-based assessments are then compared with the results derived from combining Automatic Speech Recognition (ASR) with text-based assessments by models, embeddings, and LLMs, using human assessment as the benchmark. This comparative analysis aimed to evaluate the efficacy and accuracy of direct S2S assessment methods in interpreting studies.
2. Literature review
2.1 Features of simultaneous interpreting
Simultaneous interpreting (SI) is one of the most cognitively demanding language mediation activities, one that requires interpreters to process and reformulate information across languages in real-time with minimal delay. This practice emerged in the 1920s with the development of transmission equipment that enabled interpreters to work simultaneously rather than consecutively (Pöchhacker, 2022). Research has established a fundamental distinction between consecutive interpreting (CI), where rendition follows the completed source-language (SL) utterance, and SI, where interpretation occurs concurrently with the ongoing SL presentation.
The time constraints inherent in each modality necessitate distinct information-processing strategies and produce different outputs. In CI, interpreters must identify information structures, prioritize key information points, and retain them strategically through a combination of short-term memory and note-taking techniques before reconstructing them coherently in the target language (TL) (Wang, 2023). SI demands techniques such as linear processing, segmentation, and anticipation to manage the concurrent tasks of listening in the SL and speaking in the TL (Wang, 2023). This is particularly challenging because interpreters operate with only a partial view of the unfolding SL message while focusing on maintaining the flow and accuracy of information, whereas interpreters performing CI are able to process the complete message, which allows them to establish logical connections and incorporate essential supporting details after careful consideration (Wang, 2023; Yang, 2010). The difference between CI and SI could result in more lexically simplified output in CI compared to SI (Lv & Liang, 2019).
2.2 From speech-to-text to speech-to-speech in speech translation
In examining automated assessment approaches for SI, it is useful to understand the mechanisms of speech translation tasks as they share similar challenges and methodological foundations, which are briefly reviewed in this section and in section 2.3.
The field of speech translation includes two closely related tasks that share important parallels with SI. S2T converts spoken content in one language directly to written text in another, bypassing the need for explicit transcription of the SL (Anastasopoulos et al., 2022). This technology enables applications that range from multilingual subtitling to cross-language meeting documentation. S2S translation, meanwhile, transforms spoken input in an SL into spoken output in a TL with the aim of preserving not only the semantic content, but also the paralinguistic features such as intonation and speaking style (Jia et al., 2019). Both tasks fundamentally involve cross-lingual transfers under temporal constraints, rendering them technologically similar to SI.
Early speech translation systems employed cascaded architectures that connected separate components: ASR followed by machine translation for S2T, with text-to-speech synthesis added for S2S implementations (Müller et al., 2016). In recent years, we have witnessed a paradigm shift towards end-to-end neural approaches that map directly between source and target representations without explicit intermediate stages. This evolution is exemplified by Translatotron, which pioneered direct S2S translation using sequence-to-sequence modelling with spectrograms as inputs and outputs (Jia et al., 2019, 2022; Nachmani et al., 2024). More recent models such as SeamlessM4T have advanced the state of the art even more, with transformer-based architectures handling multiple languages and modalities simultaneously (Barrault et al., 2023).
2.3 Assessment of information fidelity in interpreting
An upsurge in scholarly publications on interpreting quality assessment has occurred in recent years, focusing as they have on assessment frameworks and quality measurement strategies. As Pöchhacker (2022) notes, quality in interpreting converges with diverse dimensions, including textual features, source–target correspondence, communicative effect, and interpreter skills and role performance. The International Association of Conference Interpreters (AIIC) underscores the paramount importance of interpreting quality as measured by the degree of excellence and alignment with established standards. Survey studies about quality (Bühler, 1986; Kurz, 1993, 2002; Kurz & Pöchhacker, 1995; Zwischenberger, 2010) have consistently underscored information fidelity, TL quality, and delivery as critical quality dimensions.
The assessment of information fidelity has evolved through various methodologies. Gerver’s (1969/2002) pioneering work quantified quality at the word level by counting errors, omissions, and replacements. Mackintosh (1983) enhanced assessment precision by segmenting sentences into meaningful units with predefined point values. Carroll (1978) shifted the emphasis to holistic sentence-level analysis, focusing on the informational correspondence between source and target texts. Tiselius (2009) later modified Carroll’s scale specifically for interpreting assessments by adapting it to spoken-language contexts. Lu (2018) identified operational constraints, SL factors, and interpreting direction as key contributors to the loss of propositional information in SI.
Whereas propositional analysis offers a structural approach to assessment by deconstructing texts into fundamental units for comparative evaluation, scale-based scoring has emerged as the predominant methodology in recent years. Propositional analysis breaks down texts into fundamental propositional units for comparative evaluation (Lambert, 1988; Lee, 1999, 2002; Liu & Chiu, 2009; Lu, 2018, 2020). However, Clifford (2002) has noted that this approach often fails to capture subtler aspects such as attitudes, discourse styles, modalities, and speech acts.
Scale-based scoring has become prevalent due to its broader applicability and ease of implementation (Han, 2017; Lee, 2008; Liu & Chiu, 2009; Tiselius, 2009; Yeh & Liu, 2006). Han (2017) demonstrated that rating scales performed consistently well across different evaluations, while Nia and Modarresi (2019) validated a rubric for consecutive interpreting assessment comprising 22 items distributed over four factors. Wu et al. (2013) confirmed the reliability and validity of the analytic rating scales of the CETICE (Chinese and English Translation and Interpretation Competency Examinations) without detecting halo effects. Despite its comparative reliability against other methodologies (Han, 2015, 2017; Lee, 2015; Liu, 2013), scale-based assessment faces challenges in scale design, rater consistency, and dependence on professional judgement.
2.4 Text-based automatic assessment of interpreting quality
Recent studies have begun to automate the text-based assessment of interpreting quality, primarily using ASR technology for transcription, followed by three main assessment approaches. First, Machine Translation Quality Estimation (MTQE) models assess the semantic similarity between transcribed source and target segments at the sentence level. Second, LLMs measure the semantic similarities of texts based on transcripts. Third, the vectorisation of transcribed segments enables their cosine similarity to be assessed in order to evaluate their semantic alignment.
In adapting translation metrics for the assessment of interpreting, researchers employ the reference-based metrics originally designed for MT. These include BLEU (Papineni et al., 2002), which analyses n-gram similarity between interpreted transcripts and references; NIST (Doddington, 2002), which prioritizes contextually significant n-grams in interpreted content; METEOR (Banerjee & Lavie, 2005), which evaluates interpreting quality through precision, recall, and synonym recognition; and TER (Snover et al., 2006), which quantifies the edits required to align interpreted text with reference transcripts. The more advanced reference-based BERTScore model (Zhang et al., 2019) uses BERT’s contextual embeddings to assess interpreting fidelity, whereas COMET (Rei et al., 2020) employs deep learning to analyse the semantic and contextual relationships in interpreted content.
The evolution towards reference-free assessment methods has particular relevance to interpreting studies, where reference translations are often unavailable. This advancement relies on neural networks (RNNs, CNNs, and Transformers) to enhance cross-sequence contextual understanding. The WMT Quality Estimation framework has produced models applicable to interpreting assessment, including TransQuest (Ranasinghe et al., 2020), which combines XLM-RoBERTa embeddings with Transformers, and COMET-QE (Rei et al., 2020).
For cross-lingual assessment critical to interpreting evaluation, multilingual text-embedding models offer significant advantages. The LabSE model (Feng et al., 2022), for instance, captures semantic details across languages; SentenceBERT (Reimers & Gurevych, 2019) generates meaning-reflective embeddings for interpreted segments; mUSE (Yang et al., 2020) enhances cross-lingual understanding across various NLP tasks, and LASER (Artetxe & Schwenk, 2019; Heffernan et al., 2022) facilitates the direct comparison of source and interpreted content through fixed-size semantic vectors.
In translation and interpreting assessment, researchers typically compare automatic methods with human judgement. Chung (2020), for instance, demonstrated BLEU’s and METEOR’s potential as reliable tools for measuring German–Korean translation quality. Han and Lu (2021) expanded the metrics for consecutive interpreting assessment, revealing a significant correlation between various metrics at the sentence level for English–Chinese interpretations. Wang and Wang (2024) found superior performance by cross-lingual embeddings compared to that of MTQE models and traditional MT metrics.
Fantinuoli and Wang (2024) incorporated GPT-based LLMs to assess English–Spanish interpreting quality directly; they found that GPT models, especially GPT-3.5 with direct prompting, align most closely with human evaluations of semantic similarity, with the context window size significantly affecting this correlation.
The field continues to evolve, with innovations such as GEMBA (Kocmi & Federmann, 2023), a GPT-derived metric which evaluates translation quality with or without references and displays accuracy comparable to human evaluations across multiple language pairs. Another innovation is that of Fernandes et al. (2023), who introduced AUTOMQM. It leverages LLMs to identify and classify errors in translations, providing transparent analysis that is aligned with human-annotated errors. Both approaches use a one-to-five-star ranking methodology (GEMBA-stars).
2.5 Speech-to-speech evaluation metrics and representations
In the realm of speech modalities, a few neural network models have been developed to generate speech representations and evaluate S2S translations. One notable model – Wav2Vec-BERT 2.0 – was developed by Facebook AI Research (FAIR) (Baevski et al., 2020). This model initially learns from extensive volumes of unlabelled audio data. It is trained to predict small segments of audio that are masked during the learning phase. Following this unsupervised pre-training, the model can be fine-tuned with a limited set of labelled data to perform specific tasks.
Wav2Vec-BERT 2.0 (Baevski et al., 2020) offers two representations of input data: last hidden states and embeddings. The last hidden state – the output from the model’s final layer before any task-specific output layer (e.g., classification or embedding layer) – encapsulates the most refined version of the input data. This state, which is highly context-sensitive, varies substantially according to different inputs, reflecting the model’s response to the specific characteristics of the input data at any given moment. In contrast, embeddings provide a more abstract representation. Typically derived from hidden states through additional transformations or directly generated for this purpose, embeddings aim to capture essential features of the input data; in this way, they provide stability and general applicability for various tasks, including classification, detection, and integration into subsequent modelling processes.
Following the paradigm established by Wav2Vec-BERT 2.0, HuBERT (Hidden Unit BERT) (Hsu et al., 2021) represents another innovative self-supervised learning model from Facebook AI, one that is specifically designed for speech-processing tasks. Similar to Wav2Vec2-BERT 2.0 in certain respects, HuBERT introduces distinct methodologies and capabilities. The core of its approach lies in its learning speech representations by predicting hidden units of speech that are not directly observable during training. This prediction of unobserved elements enables HuBERT to capture the underlying structures of speech, which facilitates the modelling and processing of speech data without the need for explicit supervision.
In the light of models such as Wav2Vec-BERT 2.0 and HuBERT, it is crucial to recognize the distinctions between speech and text embeddings. Speech embeddings, such as those generated by models such as Wav2Vec-BERT 2.0 (Baevski et al., 2020) and HuBERT (Hsu et al., 2021), include not only the information from the audio segments and contextual understanding from the surrounding audio, but also paralinguistic features such as intonation and rhythm, which are absent in text embeddings. In contrast, text embeddings focus on the semantic and syntactic properties of written text. Speech representations are primarily used for downstream speech-processing tasks, notably speech recognition.
In contrast to speech representations, specialized evaluation metrics such as BLASER (Chen et al., 2023) are designed specifically to measure the accuracy of S2S translations. BLASER uses two distinct embedding types: SpeechLASER, which requires a reference translation for comparison, and SONAR, which allows for reference-free quality assessments. Central to BLASER’s approach is its multimodal encoder, which encodes both the source speech and its translated output into a multidimensional space. This space is then used to calculate the scores for translation quality. For unsupervised assessments, this score is derived from the cosine similarity between embeddings, whereas supervised assessments enhance the accuracy by incorporating human ratings into the feature-training process.
2.6 Summary
Despite extensive advancements in automated assessment methods, a significant research gap persists in the direct S2S evaluation of interpreting quality. BLASER offers a specialized framework for S2S translation assessment. However, its applicability to interpreting contexts remains unverified due to fundamental differences between its training datasets (TED Talks and native-speaker recordings) and authentic interpreting scenarios, which feature constrained language use and distinctive paralinguistic elements. Similarly, speech representation models such as Wav2Vec-BERT 2.0 and HuBERT, while capable of capturing the paralinguistic features absent in text embeddings, may deal inadequately with interpreting-specific characteristics; this suggests that initial experiments should prioritize the assessment of information fidelity rather than aspects of delivery. In addition, the literature indicates that, although LLMs have been successfully applied to text-based interpreting evaluation, their potential for direct speech-modality assessment remains unexplored. This is a particularly promising research direction, given SI’s dual-channel audio structure, which facilitates source–target alignment in contrast to CI’s sequential delivery format that complicates such parallel analysis.
3. Research questions
Based on the discussions in the literature review, while S2S assessment of interpreting quality is theoretically viable, it calls for empirical testing. Therefore, this research tests S2S assessments using BLASER, embeddings, and the last hidden state from Wav2Vec-BERT 2.0 (hereafter referred to as Wav2Vec) and HuBERT, along with LLMs (GPT) for evaluation based on direct speech. As a reference for comparison, text-based assessments are conducted using COMET, TransQuest, and GPT. By comparing S2S evaluation with text-based assessment, this study responded to the following three research questions:
· RQ1. Can speech-to-speech translation metrics such as BLASER or speech embeddings be used to assess information fidelity automatically in SI?
· RQ2. How does S2S assessment perform in comparison to automatic assessment that employs ASR combined with text-based metrics or LLM-based scores, using human judgement as the benchmark?
· RQ3. To what extent do combined metrics from both S2S and text-based assessments enhance the accuracy and reliability of interpreting quality assessment over using either approach in isolation?
4. Data and methodology
4.1 A dataset of interpreting performance
In this study, we collected data from a homogeneous group of participants who were tailored to meet our research objectives. The cohort consisted exclusively of full-time students aged between 22 and 24 who were participating in a postgraduate professional interpreting programme. All of them are native Mandarin Chinese speakers, which was the TL in the study. We carefully selected this specific age range and language background to reduce variability and control external influences. Our goal in selecting this particular demographic was to facilitate a thorough analysis of SI performance in a controlled educational setting, in this way intending to provide insights that are relevant to similar academic contexts.
The recordings of these interpreting performances were collected at the end of the second semester, by which time all of the participants had undergone one year of professional training and were competent in performing English to Mandarin SI. During that semester, the participants were tasked with the SI of an approximately 12-minute speech at the end of the semester. The speech was delivered extemporaneously – speakers prepared the speech in advance but delivered it in an authentic and spontaneous manner without reading from a script. As a result, 12 interpreting recordings were collected, each of them lasting approximately 12 minutes. The 12 recordings of SI created a dataset totalling 144 minutes, divided into 150 audio segments.
4.2 Assessment by human raters
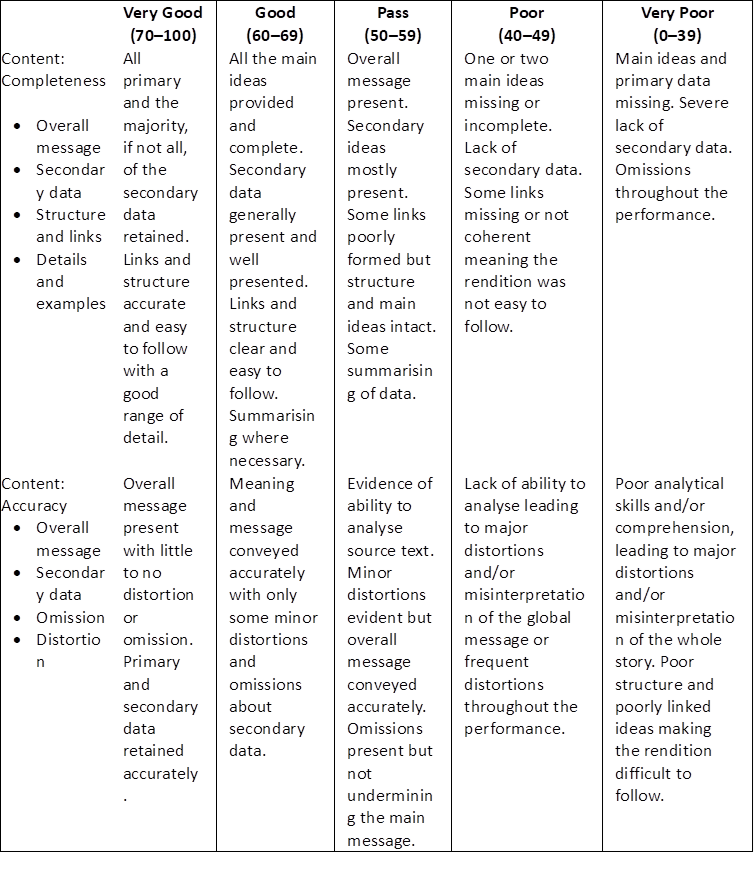
The assessment was carried out by two experienced raters: a native English-speaking tutor and a Mandarin Chinese interpreting tutor, each with more than ten years of professional interpreting experience. They evaluated each interpreting performance using criteria such as accuracy and completeness, which are detailed in the Assessment Criteria for Simultaneous Interpreting Modules (Interpreting teaching team, 2020), indicated in Appendix A. For the assessment, the raters employed a structured five-tier grading system, which was categorized as: Very Poor, Poor, Pass, Good, and Very Good. This system is convertible into a numerical scale ranging from 1 to 5 points.
4.3 Speech-to-speech assessment
The initial step in direct S2S assessment involved segmenting recordings that contain both the source speech and the target interpretations into one-minute intervals. Subsequently, we employed FFmpeg, a comprehensive multimedia software suite, to separate the stereo MP3 files into distinct mono WAV files for each language channel – specifically, English and Mandarin. This process resulted in multiple one-minute segments of both source speech and target interpretations, which were stored in a database. Importantly, the corresponding segments of source speech and target interpretations were aligned with identical timestamps, which facilitated paired processing for subsequent assessments. It is noted that, although this segmentation may result in sentences ending unnaturally and minor misalignments due to the ear–voice span, it does enable fully automated processing through rule-based programming. This advantage could become even more significant if the process were to be developed into a dedicated tool in the future.
For the evaluation phase, specifically using GPT 4.0, we developed detailed prompts that direct the model to assess the semantic similarity between pairs of source and target segments from our interpreting dataset on the speech level. The prompt was as follows:
Score the speech segment of Chinese interpretation against the segment of English original speech on a continuous scale from 1 to 5. A score of one implies: Poor analytical skills and/or comprehension resulting in significant distortions and misunderstandings of the main narrative. The explanations are inadequate, leading to a highly inaccurate rendition. Essential ideas and primary data are missing, coupled with a severe deficiency in secondary data. The overall structure is lacking, with disjointed ideas making the rendition difficult to comprehend. Meanwhile, a score of five suggests: The primary message is conveyed with minimal to no distortion or omission. Both secondary and primary data are preserved accurately. The rendition maintains clarity in its links and structure, with details presented comprehensively.
We also used BLASER2[i] to perform reference-free assessment. This approach did not rely on references; instead, it began with the extraction of embeddings from the segments of source speech and target interpretations using the SONAR model. These embeddings allowed for the computation of similarity scores between the source and target outputs by BLASER2, which provided a measure of interpreting quality without the need for predefined reference texts.
In addition, we used the embeddings and the last hidden states from both Wav2Vec[ii] and HuBERT.[iii] The feature extraction methodology involved two critical processes which used these models. First, embedding extraction was conducted: both models were employed to extract deep speech embeddings from normalized waveforms. Second, the last hidden state extraction was performed: the final hidden states of the outputs from both HuBERT and Wav2Vec were computed.
In the similarity computation phase, cosine similarity was calculated for both sets of features: embeddings and last hidden states. This metric is used to measure the semantic closeness between segments of target interpretations and segments of a source speech, assessing how accurately the interpretations reflect the original content.
4.4 Text-based assessment
To diversify our evaluation methods for the purpose of comparison, we also conducted reference-free text-based assessments. This process begins by segmenting the audio recordings into one-minute intervals, followed by isolating the source speech and the target interpretations. For the transcription, we implemented Google Cloud Speech-to-Text API[iv] using the Python client library. The implementation involved four main steps:
1. initializing the API client with service account credentials;
2. configuring recognition settings with appropriate language codes and enhanced models with automatic punctuation enabled;
3. uploading audio as 16kHz FLAC files, and
4. retrieving the transcription results via synchronous recognition requests.
Each transcription underwent verification by human raters to ensure its accuracy. Corresponding transcriptions of source speech and target interpretations were paired and stored in our database for further analysis.
Models distinguished by their training methodologies, data sources, and specific adaptations for tasks were incorporated into our study. Notably, TransQuest[v] (Ranasinghe et al., 2020), which is designed to assess translation quality, was selected. We leveraged TransQuest’s functionalities to extract both direct assessment scores and human-centric error rates, employing models such as MonoTransQuest and SiameseTransQuest for direct assessments and another version of MonoTransQuest for HTER.
For the assessment using COMET analysis, the process begins with the installation of the COMET[vi] package, which provides access to a suite of models tailored to evaluating quality. Once installed, the COMET model is accessed and deployed specifically to estimate the sentence-level quality. The model then employs machine learning algorithms to analyse each paired segment and calculate a single quality score for it.
In addition, we used the LLM – specifically the GPT-3.5 Turbo model accessed via the OpenAI API (Radford et al., 2018, 2019; Brown et al., 2020) – to assess the fidelity of the information in the transcriptions, as it is well-suited to processing batches of textual data. We prompted the LLM with the transcribed source speeches and their corresponding target interpretations. The prompts are tailored to assess the interpreting quality based on a scale from 1 to 5, with criteria adapted from Interpreting teaching team (2020). A score of 1 indicates poor comprehension and significant distortions, whereas a score of 5 suggests excellent fidelity that preserves both primary and secondary data with comprehensive clarity in the narrative structure. The prompt was as follows:
Score the following transcribed Chinese interpretation against transcribed English source speech on a continuous scale from 1 to 5. A score of one implies: “Poor analytical skills and/or comprehension resulting in significant distortions and misunderstandings of the main narrative. The explanations are inadequate, leading to a highly inaccurate rendition. Essential ideas and primary data are missing, coupled with a severe deficiency in secondary data. The overall structure is lacking, with disjointed ideas making the rendition difficult to comprehend.” Meanwhile, a score of five suggests: “The primary message is conveyed with minimal to no distortion or omission. Both secondary and primary data are preserved accurately. The rendition maintains clarity in its links and structure, with details presented comprehensively.”
4.5 Statistical analysis
To evaluate the performance of different models we initially conducted a descriptive analysis, particularly comparing direct S2S with text-based assessments using ASR and translation quality estimation models. This analysis focused on the scores obtained from the two distinct machine-based methods to examine the distribution and central tendencies of the scores of each tool.
Subsequently, we analysed the trends and variance in model scores across audio segments and variance in order to determine the reliability and consistency of the different models. This step involved scrutinizing the way in which model performance fluctuated across different segments and under various conditions so as to gauge each model’s stability and predictability.
Correlation coefficients were calculated to ascertain the linear relationships between the scores from the different tools, which offered insights into how consistently various models evaluated the same dataset. This analysis was complemented by scatter plots, which provided a visual representation of each model’s predictive performance and reliability. By integrating both statistical and graphical analyses, the study presented a detailed assessment of how well automated systems can emulate human evaluative criteria in assessing the quality of interpreting.
In addition, machine-generated scores were compared with human judgements using a regression model. Given that human scores encompass the entirety of an interpretation whereas machine scores are specific to individual minutes, we aggregated the machine scores for each complete interpretation before performing a correlation analysis with the human scores. This aggregation ensured that the analysis reflected the overall quality of the interpretation as judged by human beings, which facilitated a more comprehensive comparison of the human and machine assessments.
5. Results
5.1 Descriptive analysis of assessment methods
In assessing the performance of various models for evaluating the quality of S2S and text-based translation, descriptive statistics were computed for each model’s score distribution across 150 audio-file segments. The S2S assessment models include HuBERT embeddings, HuBERT’s last hidden state, Wav2Vec embeddings, Wav2Vec’s last hidden state, and both supervised and unsupervised BLASER models. The text-based assessment models consisted of COMET-QE, TransQuest Mono DA, TransQuest Mono HTER, TransQuest Siamese DA, and GPT-3.5 Turbo. These descriptive statistics helped to characterize the distribution and variability of the similarity scores produced by each model, which offered insights into the consistency, range, and central tendency of their quality assessments.
Table 1
Descriptive statistics of similarity-based quality scores generated by S2S and text-based assessment models

Of the S2S models, HuBERT embeddings show the lowest mean similarity score (0.12) with a relatively high standard deviation (0.16), indicating high variability. In contrast, Wav2Vec embeddings produce a perfect average score (1.00) with no variation, suggesting either high consistency or possible ceiling effects. The supervised BLASER model achieves a much higher mean (3.22), but its scale differs from those of the other models, because it uses a scoring range not normalized to [0,1].
For the text-based models, COMET-QE has the lowest average score (0.03), with a very narrow score range. The TransQuest models perform within a higher and more stable band, averaging between 0.61 and 0.68. The GPT-3.5 Turbo model shows the greatest variability among the text-based models, with a wide range from 0.00 to 0.75 and a relatively high standard deviation (0.32), which suggests less consistency but greater sensitivity to input diversity.
5.2 Trend and variance analysis
In our analysis of various S2S and text-based quality assessment models (hereafter referred to as S2S assessment models and text-based models, respectively) we observed distinct scoring patterns across segmented minute intervals of audio files. As shown in Figure 1, the models form two clearly separated clusters with different scoring ranges. The upper cluster (scores 3.0–4.0) consists predominantly of BLASER models (both supervised and unsupervised), whereas the lower cluster (scores –1.0 to 1.0) includes the remaining models.
Figure 1
Trend of scores over minute segments by models
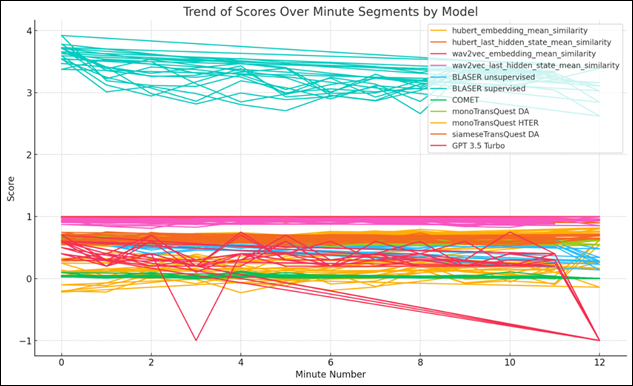
In the upper cluster, BLASER models show gradually declining trends from minute 0 to minute 12, with the unsupervised variant starting higher (approximately 3.9) but demonstrating more pronounced fluctuations throughout the segments. The supervised BLASER model maintains slightly more consistent scoring, although both exhibit a downward trend as the segment time increases.
Most notably, GPT-3.5 Turbo displays dramatic instability, with sharp drops at minutes 3 and 12 (reaching approximately –1.0), which suggests severe performance degradation when it encounters certain audio characteristics. This extreme variance distinguishes it from the other models in the lower cluster, which maintain more consistent scoring despite minor fluctuations.
Figure 2 presents a streamlined view of these trends by assessment mode. The S2S assessment models (blue line) consistently score higher (average approximately 1.1) than the text-based models (yellow line, average approximately 0.5) across all the audio segment indices. The considerable gap between these modes (approximately 0.6 points) persists throughout the assessment, indicating a fundamental difference in the way these approaches evaluate interpreting quality.
Figure 2
Streamlined trend of scores over minute segments by assessment modes
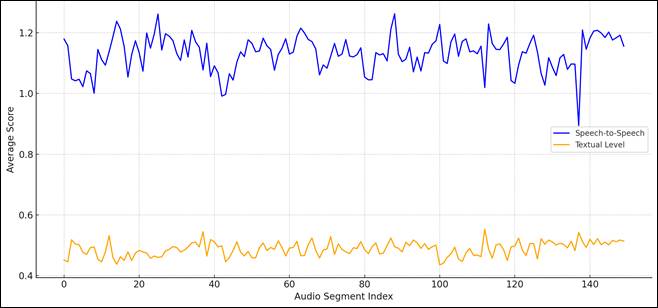
The trend for S2S assessment models exhibits pronounced oscillations with significant peaks and troughs, reflecting greater sensitivity to segment-by-segment variations in the audio characteristics. The amplitude of these oscillations (approximately ±0.2) indicates that, whereas the S2S assessment models (including the BLASER, HuBERT, and Wav2Vec variants) generally perform well, their consistency varies substantially across different audio conditions.
In contrast, the text-based models demonstrate a more stable trend with less dramatic fluctuations (approximately ±0.1), which is probably due to the normalizing effect of the transcription process. By converting speech to text before assessment, text-based models (which include COMET, monoTransQuest DA, monoTransQuest HTER, siameseTransQuest DA, and GPT-3.5 Turbo) filter out acoustic variations, which results in more consistent evaluations across segments. However, this stability comes at the cost of consistently lower scores, which suggests that the text-based models may be more stringent in their quality assessment or less responsive to positive aspects of the interpretations that are captured in direct speech evaluation.
The variance analysis (Figure 3) quantifies these observations, revealing that GPT-3.5 Turbo exhibits the highest variance by a substantial margin (approximately 0.10) – more than double that of any other model. This explains the extreme fluctuations observed in Figure 1, where GPT-3.5 Turbo scores plummet dramatically at specific points in time. The supervised BLASER model demonstrates the second highest variance (approximately 0.05), which is noteworthy, given its position in the upper scoring cluster. This indicates that, despite its generally higher scores, the supervised BLASER exhibits considerable inconsistency across different audio segments.
Figure 3
Variance of scores across models
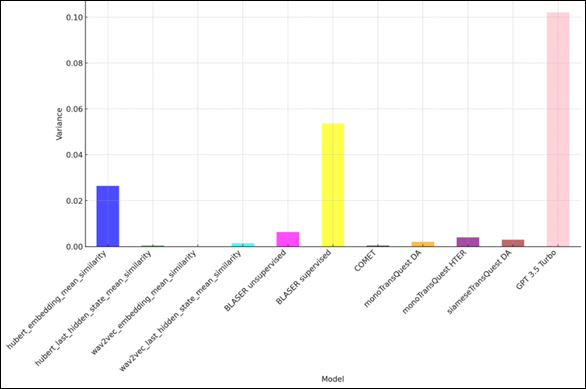
The HuBERT embedding mean similarity shows the third-highest variance (approximately 0.025), whereas most other models – including Wav2Vec embedding mean similarity, HuBERT last hidden state mean similarity, and Wav2Vec last hidden state mean similarity – demonstrate remarkably low variance (below 0.01). The COMET, monoTransQuest DA, monoTransQuest HTER, and siameseTransQuest DA models all show minimal variance, with values close to zero, which indicates highly consistent scoring behaviour regardless of the characteristics of the audio segment.
5.3 Correlation analysis
In assessing the alignment between the machine-generated interpreting quality scores and the holistic human judgements, a correlation analysis was conducted. The study involved aggregating the machine scores across all segments of each audio file so as to derive a composite machine score, which was then correlated with the corresponding human ratings.
The results of the correlation analysis reveal a varied spectrum of alignment across different models. Notably, the GPT-3.5 Turbo model exhibited the highest positive correlation (Pearson r = 0.663), which suggests a strong congruence with human judgements; this is closely followed by the BLASER unsupervised model (r = 0.633) and the BLASER supervised model (r = 0.617). These findings underscore the potential of these models to approximate human-like assessments in interpreting quality under the study conditions.
Figure 4
Correlation between human ratings and assessment across models and embeddings
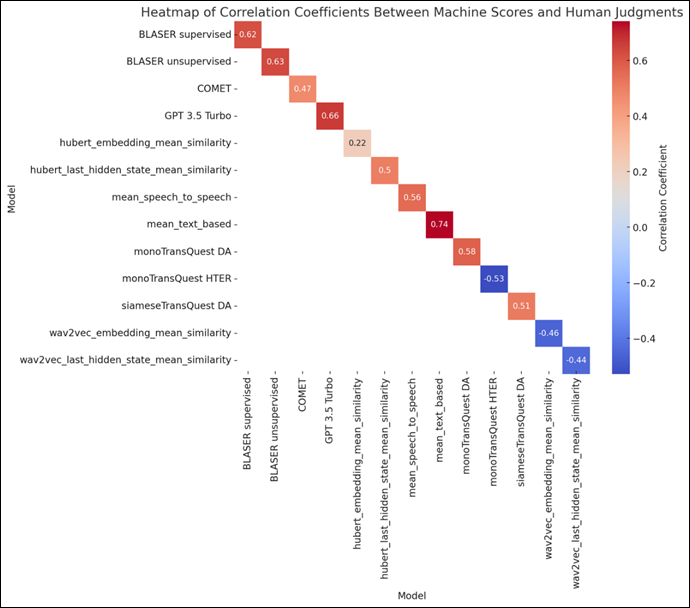
Models such as Wav2Vec Embeddings and TransQuest Mono HTER demonstrated significant negative correlations (r = −0.455 and r = −0.529, respectively), which indicates a divergence from human assessments. The most robust alignment was observed with the mean of text-based models, which achieved the highest correlation of r = 0.742. This suggests that the assessments of text-based models’, when aggregated, are particularly effective at mirroring holistic human ratings.
To elucidate further the relationships and trends identified in the correlation analysis, scatter plot visualizations were employed. These plots provided a graphic representation of the data, illustrating the degree to which the scores from each model agreed with human judgements. The scatter plots highlighted the density and spread of the data points around the regression lines, visually substantiating the correlation coefficients.
Figure 5
Scatter plot of assessment results aligned with human ratings
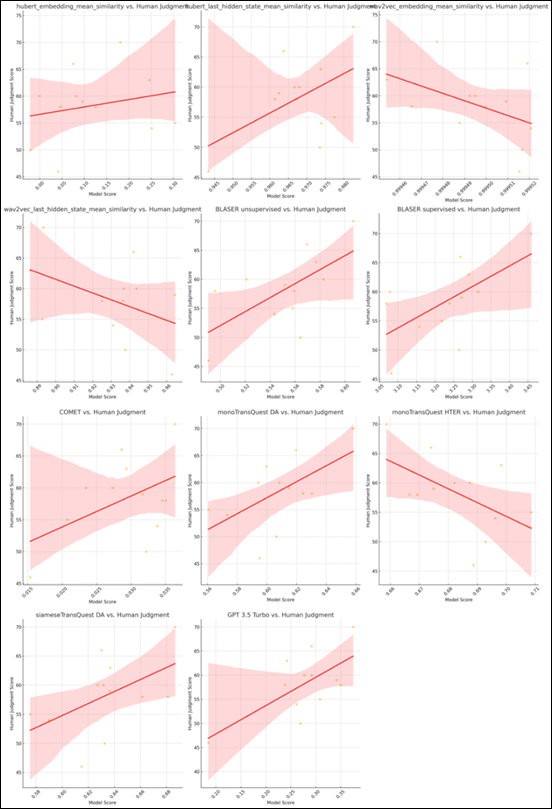
For instance, the scatter plots for the GPT-3.5 Turbo, BLASER unsupervised, and BLASER supervised models indicated a close clustering of data points along the upward trending regression lines, which confirms their strong positive correlations with human ratings. This visual clustering indicates not only alignment with but also consistency in the models’ evaluations as compared to human assessments. In contrast, the scatter plots for the Wav2Vec Embeddings and TransQuest Mono HTER models reveal more dispersed data points and downward sloping regression lines, illustrating their negative correlations. These plots effectively underscore the extent to which these models diverge in their evaluation criteria from those typically employed by human judges. Furthermore, the visual analysis again highlights the exceptional performance of the mean of text-based models, with a densely packed cluster of data points closely hugging a steeply sloping regression line.
5.4 Regression model analysis
Ridge regression was implemented to deal with multicollinearity in the interpretation quality prediction models, particularly between the BLASER unsupervised and supervised metrics (r = 0.949). This regularization approach enabled the stabilization of regression coefficients while retaining all the potentially valuable predictors. An analysis of the Variance Inflation Factors (VIFs ranging from 14.65 to 17.51 for BLASER metrics) confirmed their multicollinearity, validating the methodological rationale for employing ridge regression in this context.
Our analysis reveals that, despite testing various regularization strengths (λ) ranging from 0 to 100, the optimal model remains the original unregularized multiple regression model (λ = 0) using three primary metrics: BLASER unsupervised, BLASER supervised, and monoTransQuest DA. This model achieves an R² of 0.6155 and an adjusted R² of 0.4713, which serves to explain a substantial portion of the variance in the human quality ratings. The regression equation –Human Rating = 10.1953 + 281.7819 × BLASER unsupervised – 65.7357 × BLASER supervised + 172.8500 × monoTransQuest DA – demonstrates the complex interplay between these metrics.
When examining the effect of increasing regularization strength, we observe a classic bias–variance trade-off. With mild regularization (λ = 0.01 to 0.1), coefficients begin to stabilize with minimal impact on predictive performance (R² decreases slightly to 0.6103). At moderate regularization levels (λ = 0.5 to 1), we see more substantial coefficient shrinkage, with the BLASER supervised coefficient becoming less negative (–19.5394 at λ = 0.5) and R² declining to 0.5540. With strong regularization (λ ≥ 5), the coefficient for BLASER supervised actually becomes positive, which is consistent with its simple correlation with human ratings but at the cost of significantly reduced predictive power (R² = 0.5012 at λ = 5).
Experimenting with different combinations of predictors reveals that while including additional metrics can increase the apparent model fit, it often results in overfitting. The “all text metrics” model, incorporating six text-based metrics, achieves the highest raw R² of 0.7150 but a lower adjusted R² (0.3730) than the baseline three-metric model; this indicates that the increased complexity does not justify the marginal improvement in fit. Similarly, the “audio + text metrics” model, which adds acoustic features, achieves an R² of 0.5868 and an adjusted R² of 0.3507; this demonstrates that audio features contribute some complementary information but not sufficient to surpass the simpler baseline model.
The “all metrics” model with no regularisation achieves a perfect fit (R² = 1.000), which is an unambiguous sign of severe overfitting, given our small sample size. This model produces extreme coefficient values and exhibits complete instability, further emphasizing the need for either regularization or dimensionality reduction when working with many predictors on limited data. As regularization increases, the performance of this model declines rapidly, confirming that the apparent perfect fit was entirely artificial.
6. Discussion
6.1 Applicability of speech-to-speech metric and representation
In responding to the first research question, the successful application of embeddings and the last hidden state from Wav2Vec, along with BLASER, to the assessment of SI provides empirical evidence that S2S embeddings and translation metrics can be used in the automatic assessment of information fidelity in SI. Notably, this process does not involve automatic transcription; instead, it assesses fidelity by directly comparing segments of source speech against segments of interpretations.
Both our experiment and the study of the development of BLASER (Chen et al., 2023) used human scoring as a benchmark to test the applicability of these metrics, which allowed for a direct comparison of BLASER’s performance across different contexts. In the study of BLASER (Chen et al., 2023), which assessed speech segments from TED talks, the correlation with human judgement was 0.494 using the unsupervised model and 0.6059 with the supervised model in Mandarin–English translation assessment. In contrast, our study revealed even better correlations in the context of SI, scoring 0.62 with the supervised model and 0.63 with the unsupervised model. These results indicate that BLASER is better suited to dealing with the unique challenges of interpreting, capturing whether the information in the interpretations is both complete and accurate.
Regarding the other two embeddings, their use in the assessment of translation quality or that of interpreting quality remains unexplored, which renders performance comparisons in these specific contexts challenging. This absence of empirical data complicates the evaluation of their full potential for interpreting quality assessment and their limitations in doing so. However, performance data from the last hidden state of HuBERT (Hsu et al., 2021) stand out, showing as they do a relatively strong correlation of 0.5. This significantly surpasses the performance of HuBERT’s general embeddings, which achieved a correlation of only 0.22.
The superior performance of the last hidden state may be attributed to several factors. First, the last hidden state in models such as HuBERT typically captures more abstract and high-level features of a speech signal that are crucial to understanding the overall context and meaning. These features are essential in interpreting quality assessment. In contrast, the general embeddings from HuBERT – being the output directly generated by the training process – are often more focused on capturing specific phonetic or acoustic features rather than on the holistic properties of the speech. These embeddings might be more suited to tasks such as speech recognition or speaker identification, where detailed acoustic information is more relevant than the broader context or the semantic content.
In addition, it is noteworthy that both the last hidden state and the general embeddings produced by Wav2Vec (Baevski et al., 2020) show a negative correlation with human judgement in assessing interpreting quality. This unexpected result highlights a challenge in the application of automated S2S metrics for evaluating interpreting quality and indicates potential misalignments between what these technologies measure and what human raters perceive as quality interpreting.
It has also been determined that LLMs such as GPT 4.0 are currently unable to assess interpreting quality directly from speech modality. According to responses from GPT, these models lack the capability to process audio files directly. GPT clarified that audio must first be transcribed into text before it can analyse and compare the content. Once transcribed, GPT can then evaluate and score the interpretation based on specified criteria. In addition, in response to the prompt, specialized AI models such as OpenAI’s Whisper, designed to transcribe and process speech directly, were recommended by OpenAI for integration into the ASR transcription and text-based assessment pipeline so as to facilitate a more streamlined evaluation process.
6.2 Comparison between speech-to-speech assessment and text-based assessment
In responding to the second research question, it was found that the most robust alignment with human scores occurred with the GPT model in text-based assessment, which scores achieve the highest correlation of r = 0.66. This is followed by BLASER’s supervised and unsupervised models, which record correlations of r = 0.62 and r = 0.63, respectively. Other models for text-based assessment, such as TransQuest and COMET, exhibit correlations around 0.5, which is comparable to some speech-based results, such as the last hidden state from HuBERT. Overall, text-based assessments generally perform better than S2S assessments. This outcome is expected since the models used for textual assessments are specifically designed for translation quality assessment, whereas most speech-based models are primarily developed for ASR tasks.
Compared to other studies assessing interpreting quality, Han and Lu’s (2021) research demonstrates slightly higher correlations with established metrics for consecutive interpreting, such as BLEU (r = 0.670), NIST (r = 0.673), and a significantly higher correlation with METEOR (r = 0.882). In contrast, Wang & Wang’s (2024) study, which also focused on text-based assessment of consecutive interpreting, reports the highest correlation with sentence-level embeddings from MUSE (r = 0.55) (Yang et al., 2020), closely followed by GPT (r = 0.53), whereas TransQuest scores correlated at around 0.45 with human ratings.
Given that both their research and ours use some of the same models to assess interpreting quality, the comparisons between these studies are particularly relevant. Our analysis indicates that LLM and TransQuest yield better performance in SI, possibly owing to the continuous and dynamic nature of this mode of interpreting. The real-time processing capabilities of LLMs may align more closely with the environment for SI, suggesting that the specific attributes of these models could be further explored to optimize quality assessments for different interpreting contexts.
6.3 Performance of combined metrics
In addressing Research Question 3 regarding the extent to which combined metrics from both S2S and text-based assessments enhance the accuracy and reliability of interpreting quality assessment over using either approach in isolation, we designed an experimental setup that incorporates a multimodal assessment strategy. This involved comparing the correlation coefficients between human judgements and each assessment method, both isolated and combined, to determine which method most closely aligns with human ratings. In addition, we developed a regression model to predict human scores using the machine-generated scores, further enhancing our understanding of how well the combined metrics perform in simulating human evaluative processes.
In our discussion of the statistical results, the significance of the differences observed between the isolated and combined metrics approaches is evident. The R2 value for the regression model, which integrates the metrics for speech and text, stands at 47%. These initial results, indicative as they are of the potential of machine-generated scores to reflect human judgements, underscore the complexities involved in modelling the data on interpreting quality.
Furthermore, the mean correlation for text-based assessments reaches as high as 0.74, significantly outperforming the mean correlation for S2S assessments, which is 0.54. This disparity highlights the challenges inherent in S2S assessments, possibly owing to the dynamic nature of spoken language, which may not be fully captured by current speech-processing technologies.
7. Conclusion
This study has explored new methods of assessing information fidelity in SI by comparing S2S assessments and those combining automatic transcription and text-based evaluation. Through experiments that leveraged LLM, S2S representations and MTQE models, we measured the semantic similarity between segments of source speech and interpretations. The findings indicate that, whereas LLMs are not suited to direct speech-based quality assessment, they exhibit the highest correlation (r = 0.66) when used for text-based evaluation. BLASER’s supervised (r = 0.62) and unsupervised models (r = 0.63) also correlate moderately with human ratings, demonstrating that it is feasible to assess the information fidelity of SI directly from S2S. Moreover, a combined metric incorporating both S2S and text-based assessments explains approximately 47% of the variance in human judgement scores based on the aggregated machine scores. This underscores the potential of integrated metrics to enhance the development of machine-learning models for assessing interpreting quality.
This use marks an advance in interpreting studies, one suggesting a new methodology for assessing the quality of interpreting without the need for extensive human intervention. By integrating both S2S and text-based metrics, this approach offers a more comprehensive assessment framework that could possibly reduce the biases and limitations inherent in using either metric alone. The hybrid approach also acknowledges the potential synergies between different types of assessment and investigates whether these combined metrics can offer a superior evaluation framework compared to using either method alone. This could be particularly relevant in scenarios where each type of metric captures different aspects of interpreting quality, possibly leading to a more comprehensive evaluation tool. As a result, it could contribute to the development of automated systems that are able to support real-time feedback and continuous improvement for interpreters.
Moreover, these findings have implications for machine interpreting (MI) research and development. The validated assessment metrics could be directly applied to evaluate end-to-end S2T and S2S MI systems, which would provide automated quality estimation capabilities for neural MI models. The demonstrated effectiveness of BLASER in direct speech assessment and LLMs for transcript-based evaluation offers practical tools for continuous quality monitoring during the training and deployment of computer-aided interpreting systems, which would ultimately advance the field towards more reliable and accurate MI solutions.
Despite the significance of this research, the study might have the following limitations: first, the number of human ratings is limited: a small sample size of human scores could constrain the effectiveness of a regression analysis, particularly in complex models that require a large dataset for effective training without the risk of overfitting. The small datasets may also lead to a high level of variability in model performance, rendering it challenging to draw reliable conclusions. Therefore, further research with larger datasets is essential to validate the findings more robustly. Secondly, LLMs are known to be highly sensitive to prompt phrasing, including variations in wording, punctuation, and formatting. In this study, only a two-prompt design was used for assessment, which may limit the generalizability and robustness of the results. Future work could explore multiple prompt formulations to examine their impact on output consistency and evaluation reliability. Thirdly, the experiment focused solely on the English–Mandarin language pair. Future research should be expanded to include a broader array of language pairs, particularly low-resourced languages, in order to verify the performance of S2S assessment across diverse contexts. Further exploration could also benefit from a systematic examination of different types of embedding in interpreting settings. By conducting controlled experiments that compare the efficacy of general embeddings versus last hidden state embeddings, researchers would be able to understand their respective strengths and limitations better. This would provide a more comprehensive understanding of the way different layers of neural network model contribute to the assessment of interpreting quality and help to refine these tools to enable them to assess automatically more accurately and reliably.
References
Anastasopoulos, A., Barrault, L., Bentivogli, L., Bojar, O., Cattoni, R., Currey, A., Dinu, G., Duh, K., Elbayad, M., & Emmanuel, C. (2022). Findings of the IWSLT 2022 evaluation campaign. In E. Salesky, M. Federico, & M Costa-Jussà (Eds.), Proceedings of the 19th International Conference on Spoken Language Translation (IWSLT 2022) (pp. 98–157). Association for Computational Linguistics. https://doi.org/10.18653/v1/2022.iwslt-1.10
Artetxe, M., & Schwenk, H. (2019). Massively multilingual sentence embeddings for zero-shot cross-lingual transfer and beyond. Transactions of the Association for Computational Linguistics, 7, 597–610. https://doi.org/10.1162/tacl_a_00288
Baevski, A., Zhou, Y., Mohamed, A., & Auli, M. (2020). wav2vec 2.0: A framework for self-supervised learning of speech representations. Advances in Neural Information Processing Systems, 33, 12449–12460. https://doi.org/10.48550/arXiv.2006.11477
Banerjee, S., & Lavie, A. (2005). METEOR: An automatic metric for MT evaluation with improved correlation with human judgments. In J. Goldstein, A. Lavie, C.-Y Lin, & C. Voss (Eds.), Proceedings of the ACL workshop on intrinsic and extrinsic evaluation measures for machine translation and/or summarization (pp. 65–72). Association for Computational Linguistics. https://aclanthology.org/W05-0909
Barrault, L., Meglioli, M. C., Dale, D., Dong, N., Duppenthaler, M., Duquenne, P.-A., Ellis, B., Elsahar, H., Haaheim, J., Hoffman, J., Hwang, M.-J., Inaguma, H., Klaiber, C., Kulikov, I., Li, P., Licht, D., Maillard, J., Mavlyutov, R., Rakotoarison, A., … Williamson, M. (2023). Seamless: Multilingual expressive and streaming speech translation. arXiv. https://doi.org/10.48550/arxiv.2312.05187
Brown, T., Mann, B., Ryder, N., Subbiah, M., Kaplan, J. D., Dhariwal, P., Neelakantan, A., Shyam, P., Sastry, G., Askell, A., Agarwal, S., Herbert-Voss, A., Krueger, G., Henighan, T., Child, R., Ramesh, A., Ziegler, D., Wu, J., Winter, C., … Amodei, D. (2020). Language models are few-shot learners. In H. Larochelle, M. Ranzato, R. Hadsell, M. F. Balcan, & H. Lin (Eds.), Advances in neural information processing systems 33: Annual conference on neural information processing systems (pp. 1877–1901). Curran Associates. https://doi.org/10.48550/arXiv.2005.14165
Bühler, H. (1986). Linguistic (semantic) and extra-linguistic (pragmatic) criteria for the evaluation of conference interpretation and interpreters. Multilingua, 5(4), 231–235. https://doi.org/10.1515/mult.1986.5.4.231
Carroll, J. B. (1978). Linguistic abilities in translators and interpreters. In D. Gerver & H. W. Sinaiko (Eds.), Language interpretation and communication (pp. 119–129). Springer US. https://doi.org/10.1007/978-1-4615-9077-4_12
Chen, M., Duquenne, P.-A., Andrews, P., Kao, J., Mourachko, A., Schwenk, H., & Costa-jussà, M. R. (2023). BLASER: A text-free speech-to-speech translation evaluation metric. In A. Rogers, J. Boyd-Graber, & N. Okazaki (Eds.), Proceedings of the 61st annual meeting of the Association for Computational Linguistics (Volume 1: Long papers) (pp. 9064–9079). Association for Computational Linguistics. https://doi.org/10.18653/v1/2023.acl-long.504
Chung, H. Y. (2020). Automatic evaluation of human translation: BLEU vs. METEOR. Lebende Sprachen, 65(1), 181–205. https://doi.org/10.1515/les-2020-0009
Clifford, A. (2002). Discourse theory and performance-based assessment: Two tools for professional interpreting. Meta, 46(2), 365–378. https://doi.org/10.7202/002345ar
Doddington, G. (2002). Automatic evaluation of machine translation quality using n-gram co-occurrence statistics. In M. Marcus (Ed.), Proceedings of the Second International Conference on Human Language Technology Research (pp. 138–145). Morgan Kaufmann. https://doi.org/10.3115/1289189.1289273
Fantinuoli, C., & Prandi, B. (2021). Towards the evaluation of automatic simultaneous speech translation from a communicative perspective. In M. Federico, A. Waibel, M. R. Costa-jussà, J. Niehues, S. Stuker, & E. Salesky (Eds.), Proceedings of the 18th International Conference on Spoken Language Translation (IWSLT 2021) (pp. 245–254). Association for Computational Linguistics. https://doi.org/10.18653/v1/2021.iwslt-1.29
Fantinuoli, C., & Wang, X. (2024). Exploring the correlation between human and machine evaluation of simultaneous speech translation. In C. Scarton, C. Prescott, C. Bayliss, C. Oakley, J. Wright, S. Wrigley, X. Song, E. Gow-Smith, R. Bawden, V. M. Sánchez-Cartagena, P. Cadwell, E. Lapshinova-Koltunski, V. Cabarrão, K. Chatzitheodorou, M. Nurminen, D. Kanojia, & H. Moniz (Eds.), Proceedings of the 25th Annual Conference of the European Association for Machine Translation (Volume 1) (pp. 327–336). https://doi.org/10.48550/arXiv.2406.10091
Feng, F., Yang, Y., Cer, D., Arivazhagan, N., & Wang, W. (2022). Language-agnostic BERT sentence embedding. In S. Muresan, P. Nakov, & A. Villavicencio (Eds.), Proceedings of the 60th Annual Meeting of the Association for Computational Linguistics (Volume 1: Long papers) (pp. 878–891). Association for Computational Linguistics. https://doi.org/10.18653/v1/2022.acl-long.62
Fernandes, P., Deutsch, D., Finkelstein, M., Riley, P., Martins, A., Neubig, G., Garg, A., Clark, J., Freitag, M., & Firat, O. (2023). The devil is in the errors: Leveraging large language models for fine-grained machine translation evaluation. In P. Koehn, B. Haddow, T. Kocmi, & C. Monz (Eds.), Proceedings of the eighth conference on machine translation (pp. 1066–1083). Association for Computational Linguistics. https://doi.org/10.18653/v1/2023.wmt-1.100
Gerver, D. (2002). The effects of source language presentation rate on the performance of simultaneous conference interpreters. In F. Pöchhacker & M. Shlesinger (Eds.), The interpreting studies reader (pp. 52–66). Routledge. (Original work published 1969)
Gile, D. (1995). Fidelity assessment in consecutive interpretation: An experiment. Target, 7(1), 151–164. https://doi.org/10.1075/target.7.1.12gil
Han, C. (2015). Investigating rater severity/leniency in interpreter performance testing: A multifaceted Rasch measurement approach. Interpreting, 17(2), 255–283. https://doi.org/10.1075/intp.17.2.05han
Han, C. (2017). Using analytic rating scales to assess English/Chinese bi-directional interpretation: A longitudinal Rasch analysis of scale utility and rater behavior. Linguistica Antverpiensia, New Series – Themes in Translation Studies, 16, 196–215. https://doi.org/10.52034/lanstts.v16i0.429
Han, C., & Lu, X. (2021). Can automated machine translation evaluation metrics be used to assess students’ interpretation in the language learning classroom? Computer Assisted Language Learning, 36(5–6), 1–24. https://doi.org/10.1080/09588221.2021.1968915
Harris, B. (1990). Norms in interpretation. Target, 2(1), 115–119. https://doi.org/10.1075/target.2.1.08har
Heffernan, K., Çelebi, O., & Schwenk, H. (2022). Bitext mining using distilled sentence representations for low-resource languages. In Y. Goldberg, Z. Kozareva, & Y. Zhang (Eds.), Findings of the Association for Computational Linguistics: EMNLP 2022 (pp. 2101–2112). Association for Computational Linguistics. https://doi.org/10.18653/v1/2022.findings-emnlp.154
Hsu, W.-N., Bolte, B., Tsai, Y.-H. H., Lakhotia, K., Salakhutdinov, R., & Mohamed, A. (2021). Hubert: Self-supervised speech representation learning by masked prediction of hidden units. IEEE/ACM Transactions on Audio, Speech, and Language Processing, 29, 3451–3460. https://doi.org/10.1109/TASLP.2021.3122291
Interpreting teaching team. (2020). Marking criteria for simultaneous interpreting. University of Leeds.
Jia, Y., Weiss, R. J., Biadsy, F., Macherey, W., Johnson, M., Chen, Z., & Wu, Y. (2019). Direct speech-to-speech translation with a sequence-to-sequence model. In G. Kubin, T. Hain, B. Schuller, D. El Zarka, & P. Hödl (Eds.), Interspeech 2019 (pp. 1123–1127). International Speech Communication Association. https://doi.org/10.21437/Interspeech.2019-1951
Jia, Y., Ramanovich, M. T., Remez, T., & Pomerantz, R. (2022). Translatotron 2: High-quality direct speech-to-speech translation with voice preservation. In K. Chaudhuri, S. Jegelka, L. Song, C. Szepesvari, G. Niu, & S. Sabato (Eds.), Proceedings of the 39th international conference on machine learning (pp. 10120–10134). MLResearchPress. https://doi.org/10.48550/arXiv.2107.08661
Kocmi, T., & Federmann, C. (2023). Large language models are state-of-the-art evaluators of translation quality. In M. Nurminen, J. Brenner, M. Koponen, S. Latomaa, M. Mikhailov, F. Schierl, T. Ranasinghe, E. Vanmassenhove, S. A. Vidal, N. Aranberri, M. Nunziatini, C. P. Escartín, M. Forcada, M. Popovic, C. Scarton, & H. Moniz (Eds.), Proceedings of the 24th Annual Conference of the European Association for Machine Translation (pp. 193–203). European Association for Machine Translation. https://aclanthology.org/2023.eamt-1.19
Kurz, I. (1993). Conference interpretation: Expectations of different user groups. The Interpreters’ Newsletter, 5, 13–21.
Kurz, I. (2002). Conference interpreting: Quality in the ears of the user. Meta, 46(2), 394–409. https://doi.org/10.7202/003364ar
Kurz, I., & Pöchhacker, F. (1995). Quality in TV interpreting. Translatio-Nouvelles de La FIT-FIT Newsletter, 15(3), 4.
Lambert, S. (1988). Information processing among conference interpreters: A test of the depth-of-processing hypothesis. Meta, 33(3), 377–387. https://doi.org/10.7202/003380ar
Lee, J. (2008). Rating scales for interpreting performance assessment. The Interpreter and Translator Trainer, 2(2), 165–184. https://doi.org/10.1080/1750399X.2008.10798772
Lee, S.-B. (2015). Developing an analytic scale for assessing undergraduate students’ consecutive interpreting performances. Interpreting, 17(2), 226–254. https://doi.org/10.1075/intp.17.2.04lee
Lee, T.-H. (1999). Simultaneous listening and speaking in English into Korean simultaneous interpretation. Meta, 44(4), 560–572. https://doi.org/10.7202/003444ar
Lee, T.-H. (2002). Ear voice span in English into Korean simultaneous interpretation. Meta, 47(4), 596–606. https://doi.org/10.7202/008039ar
Liu, M. (2013). Design and analysis of Taiwan’s interpretation certification examination. In D. Tsagari & R. van Deemter (Eds.), Assessment issues in language translation and interpreting (pp. 163–178). Peter Lang.
Liu, M., & Chiu, Y.-H. (2009). Assessing source material difficulty for consecutive interpreting: Quantifiable measures and holistic judgment. Interpreting, 11(2), 244–266. https://doi.org/10.1075/intp.11.2.07liu
Lu, X. (2018). Propositional information loss in English-to-Chinese simultaneous conference interpreting: A corpus-based study. Babel, 64(5–6), 792–818. https://doi.org/10.1075/babel.00070.lu
Lu, X. (2020). Toward an assessment system of simultaneous interpreting fidelity based on information structure theory. Journal of Foreign Languages, 43(6), 116–128.
Lu, X., & Han, C. (2022). Automatic assessment of spoken-language interpreting based on machine-translation evaluation metrics: A multi-scenario exploratory study. Interpreting, 25(1), 109–143. https://doi.org/10.1075/intp.00076.lu
Lv, Q., & Liang, J. (2019). Is consecutive interpreting easier than simultaneous interpreting? – a corpus-based study of lexical simplification in interpretation. Perspectives, 27(1), 91–106. https://doi.org/10.1080/0907676X.2018.1498531
Mackintosh, J. (1983). Relay interpretation: An exploratory study [Unpublished master’s thesis]. University of London.
Moser, P. (1996). Expectations of users of conference interpretation. Interpreting, 1(2), 145–178. https://doi.org/10.1075/intp.1.2.01mos
Müller, M., Nguyen, T. S., Niehues, J., Cho, E., Krüger, B., Ha, T.-L., Kilgour, K., Sperber, M., Mediani, M., Stüker, S., & Waibel, A. (2016). Lecture Translator—Speech translation framework for simultaneous lecture translation. In J. DeNero, M. Finlayson, & S. Reddy (Eds.), Proceedings of the 2016 conference of the North American Chapter of the Association for Computational Linguistics: Demonstrations (pp. 82–86). Association for Computational Linguistics https://doi.org/10.18653/v1/N16-3017
Nachmani, E., Levkovitch, A., Ding, Y., Asawaroengchai, C., Zen, H., & Ramanovich, M. T. (2024). Translatotron 3: Speech to speech translation with monolingual data. In ICASSP 2024-2024 IEEE international conference on acoustics, speech and signal processing (pp. 10686–10690). https://doi.org/10.1109/ICASSP48485.2024.10448426
Nia, F. K., & Modarresi, G. (2019). A Rasch-based validation of the evaluation rubric for consecutive interpreting performance. Sendebar, 30, 221–244. https://doi.org/10.30827/sendebar.v30i0.8512
Papineni, K., Roukos, S., Ward, T., & Zhu, W.-J. (2002). BLEU: A method for automatic evaluation of machine translation. In P. Isabelle, E. Charniak, & D. Lin (Eds.), Proceedings of the 40th annual meeting of the Association for Computational Linguistics (pp. 311–318). https://doi.org/10.3115/1073083.1073135
Pöchhacker, F. (2022). Introducing interpreting studies (3rd ed.). Routledge. https://doi.org/10.4324/9781003186472
Radford, A., Narasimhan, K., Salimans, T., & Sutskever, I. (2018). Improving language understanding by generative pre-training. OpenAI.
Radford, A., Wu, J., Child, R., Luan, D., Amodei, D., & Sutskever, I. (2019). Language models are unsupervised multitask learners. OpenAI Blog, 1(8), 9.
Ranasinghe, T., Orasan, C., & Mitkov, R. (2020). TransQuest: Translation quality estimation with cross-lingual transformers. In D. Scott, N. Bel, & C. Zong (Eds.), Proceedings of the 28th International Conference on Computational Linguistics (pp. 5070–5081). International Committee on Computational Linguistics. https://doi.org/10.18653/v1/2020.coling-main.445
Rei, R., Stewart, C., Farinha, A. C., & Lavie, A. (2020). COMET: A neural framework for MT evaluation. In B. Webber, T. Cohn, Y. He, & Y. Liu (Eds.), Proceedings of the 2020 conference on empirical methods in natural language processing (EMNLP) (pp. 2685–2702). Association for Computational Linguistics. https://doi.org/10.18653/v1/2020.emnlp-main.213
Reimers, N., & Gurevych, I. (2019). Sentence-BERT: Sentence embeddings using Siamese BERT-networks. In K. Inui, J. Jiang, V. Ng, & X. Wan (Eds.), Proceedings of the 2019 Conference on Empirical Methods in Natural Language Processing and the 9th International Joint Conference on Natural Language Processing (EMNLP-IJCNLP) (pp. 3982–3992). Association for Computational Linguistics. https://doi.org/10.18653/v1/D19-1410
Seleskovitch, D., Dailey, S., & McMillan, E. N. (1994). Interpreting for international conferences: Problems of language and communication (2nd ed.). Pen and Booth.
Snover, M., Dorr, B., Schwartz, R., Micciulla, L., & Makhoul, J. (2006). A study of translation edit rate with targeted human annotation. In Proceedings of the 7th Conference of the Association for Machine Translation in the Americas: Technical papers (pp. 223–231). https://aclanthology.org/2006.amta-papers.25
Tiselius, E. (2009). Revisiting Carroll’s scales. In H. E. Jacobson & C. V. Angelelli (Eds.), Testing and assessment in translation and interpreting studies (pp. 95–121). John Benjamins. https://doi.org/10.1075/ata.xiv.07tis
Wang, B. (2023). Exploring information processing as a new research orientation beyond cognitive operations and their management in interpreting studies: Taking stock and looking forward. Perspectives, 31(6), 996–1013. https://doi.org/10.1080/0907676X.2023.2200955
Wang, L., Lyu, C., Ji, T., Zhang, Z., Yu, D., Shi, S., & Tu, Z. (2023). Document-level machine translation with large language models. In H. Bouamor, J. Pino, & K. Bali (Eds.), Proceedings of the 2023 Conference on Empirical Methods in Natural Language Processing (pp. 16646–16661). Association for Computational Linguistics. https://doi.org/10.18653/v1/2023.emnlp-main.1036
Wang, X., & Wang, B. (2024). Neural network models vs. MT evaluation metrics: A comparison between two approaches to automatic assessment of information fidelity in consecutive interpreting. [Manuscript submitted for publication]
Wang, X., & Yuan, L. (2023). Machine-learning based automatic assessment of communication in interpreting. Frontiers in Communication, 8, 1047753. https://doi.org/10.3389/fcomm.2023.1047753
Wu, J., Liu, M. H., & Liao, C. (2013). Analytic scoring in interpretation test: Construct validity and the halo effect. In The making of a translator: Multiple perspectives (pp. 277–292). Bookman Books.
Yang, C. (2010). A study of information processing in interpreting. Nankai University Press Tianjin.
Yang, Y., Cer, D., Ahmad, A., Guo, M., Law, J., Constant, N., Hernandez Abrego, G., Yuan, S., Tar, C., Sung, Y., Strope, B., & Kurzweil, R. (2020). Multilingual universal sentence encoder for semantic retrieval. In A. Celikyilmaz & T.-H. Wen (Eds.), Proceedings of the 58th annual meeting of the Association for Computational Linguistics: System demonstrations (pp. 87–94). Association for Computational Linguistics. https://doi.org/10.18653/v1/2020.acl-demos.12
Yeh, S., & Liu, M. (2006). A more objective approach to interpretation evaluation: Exploring the use of scoring rubrics. Journal of the National Institute for Compilation and Translation, 34(4), 57–78.
Zhang, T., Kishore, V., Wu, F., Weinberger, K. Q., & Artzi, Y. (2019). BERTScore: Evaluating text generation with BERT. Proceedings of the 8th international conference on learning representations (ICLR). https://doi.org/10.48550/arXiv.1904.09675
Zwischenberger, C. (2010). Quality criteria in simultaneous interpreting: An international vs. a national view. The Interpreters’ Newsletter, 15, 127–142.
Appendix: Assessment criteria for simultaneous interpreting